
Control charts for ongoing process verification: what Stage 3 asks, and how to read the process, not the spec
The annual product quality review for a tablet line lands on the quality manager’s desk in March. Two hundred and forty batches, every one released, not a single out-of-specification result. Then someone plots the in-process tablet weights in batch order instead of reading them as a list. From October onwards, every batch mean sits above the long-run average. Nothing failed, but something changed: a new punch set, a different lot of lubricant, a hopper that the night shift had started running fuller. The batches were fine. The process was no longer the one that had been validated.
That gap, between a product that passes and a process that stays the same, is what a control chart is for, and what regulators mean by continued or ongoing process verification. Automation.com ran a primer on control charts on 25 March 2025, written for Six Sigma and general manufacturing. This is the same tool, taken onto a GMP line.
What the regulators actually ask
The US Food and Drug Administration (FDA) splits process validation into three stages in its January 2011 guidance. Stage 1 designs the process, Stage 2 qualifies it, and Stage 3, continued process verification, gives “ongoing assurance … during routine production that the process remains in a state of control”. Stage 3 is the only one that never ends.
The guidance is specific about method. The data “should be statistically trended and reviewed by trained personnel”, and the FDA recommends that “a statistician or person with adequate training in statistical process control techniques” develops the data collection plan and the statistical methods used to evaluate “process stability and process capability”. Procedures “should guard against overreaction to individual events as well as against failure to detect unintended process variability”. That sentence is, more or less, the whole design problem of a control chart.
In Europe, EU GMP Annex 15 (in operation since 1 October 2015) calls the same activity ongoing process verification and defines it as documented evidence that the process remains in a state of control during commercial manufacture. Its paragraphs 5.28 to 5.32 apply to traditional, continuous and hybrid validation alike. Paragraph 5.31 is the one to quote in a procedure: “Statistical tools should be used, where appropriate, to support any conclusions with regard to the variability and capability of a given process and ensure a state of control.”
| Text | Where | What it asks |
|---|---|---|
| FDA, Process Validation guidance (2011) | Stage 3 | Statistical trending by trained people; intra- and inter-batch variation; alert and action limits; avoid both overreaction and missed variability |
| EU GMP Annex 15 (2015) | 5.28–5.32 | A state of control with process trends evaluated; an approved protocol and a report; statistical tools for variability and capability; results feed the product quality review |
| EU GMP Chapter 1 | 1.10 | Annual quality reviews that verify the consistency of the process and highlight trends |
| EU GMP Chapter 6 | 6.9, 6.16 | Data recorded so they can be trended; out-of-trend results investigated; critical results trended |
| ICH Q10 (2008) | 3.2.1 | A monitoring system with statistical tools that verifies continued operation within a state of control and identifies sources of variation |
| 21 CFR 211 | 211.180(e) | Records kept so that the quality standards of each product can be evaluated at least annually |
None of these texts names a particular chart. What they ask for is a state of control that statistics can defend.
A control chart in one paragraph
Walter Shewhart’s idea was to separate two kinds of variation. Common-cause variation is the noise a stable process always produces; special-cause variation comes from something that changed. A Shewhart chart plots a statistic in time order, draws a centre line where the process actually runs, and places control limits three standard deviations of that statistic either side. ISO 7870-2:2023, the second edition of the international standard on Shewhart charts, published in March 2023, explains the trade-off. With normal data and a stable process, about 0.3% of points fall outside three-sigma limits by chance, roughly three in a thousand. Narrower limits send people chasing ghosts; wider ones let real shifts through.
The standard also describes two-sigma “warning limits” that call for a closer look rather than action, and it separates two phases. In Phase 1 you set trial limits from historical data, remove points with a known special cause and recompute. In Phase 2 you freeze those limits and monitor. Write down when one ends and the other begins, because six months later somebody will ask.
Control limits are not specifications
A specification is the voice of the patient. It comes from the marketing authorisation and says what every batch must meet. A control limit is the voice of the process: it is calculated from the process’s own data and describes what the process normally does. A process can be in perfect statistical control and still produce batches out of specification, if it is badly centred or too variable. Another can sit comfortably inside specification while it drifts, which is exactly the tablet line above.
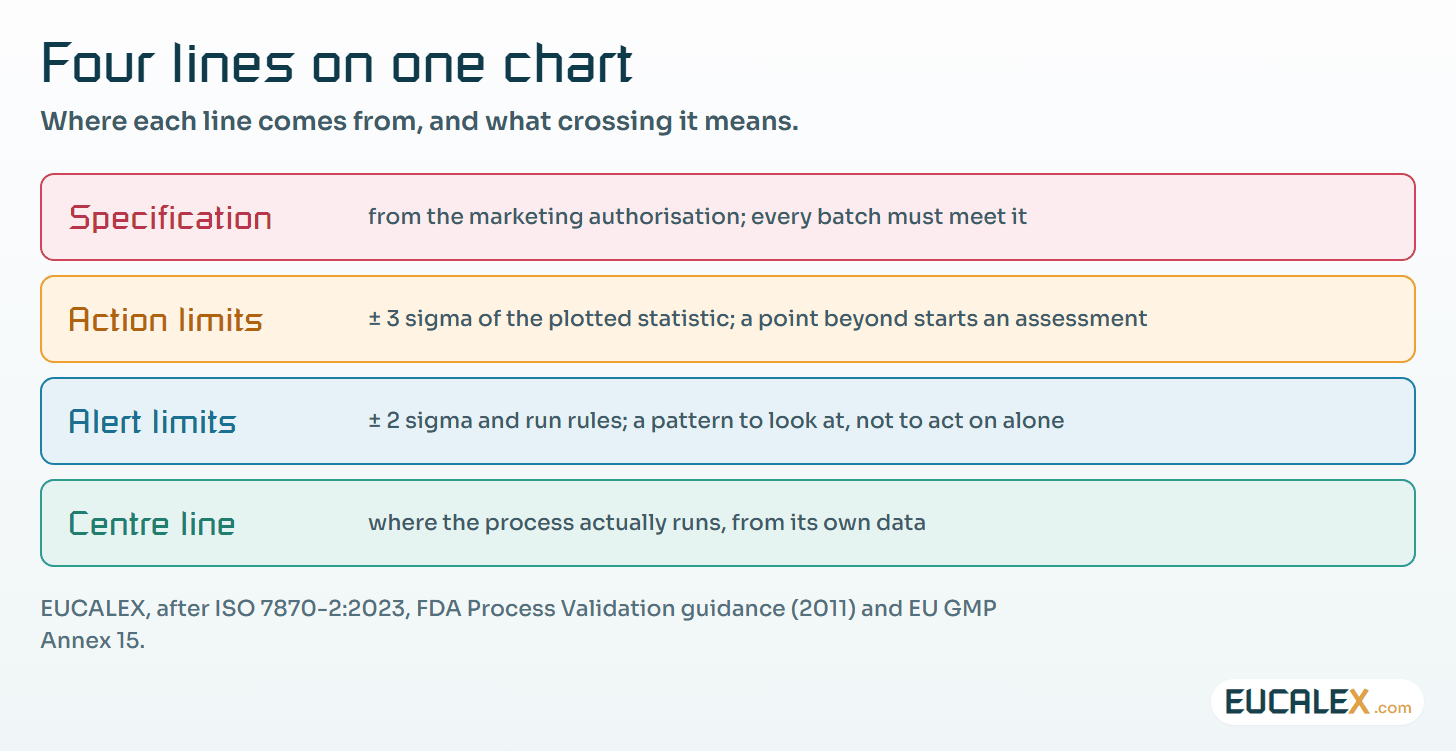
So never draw the specification in place of the control limits. And never tighten a specification because the limits happen to be narrower; that is a regulatory change, not a statistical one.
Capability is the bridge between the two. Capability indices compare the spread of a stable process with the width of the specification; ASTM E2281, the practice the FDA guidance cites in a footnote, covers Cp, Cpk, Pp and Ppk. Cpk is the distance from the process mean to the nearest specification limit, divided by three standard deviations. Take tablet weight with a specification of 237.5 to 262.5 mg, a process mean of 251 mg and a standard deviation of 2.5 mg: Cpk = (262.5 − 251) / 7.5 ≈ 1.53. A capability index only means something once the chart shows the process is stable, though. On a drifting process it describes a process that no longer exists.
Which chart for which data
The choice depends on how the data arrive, not on whatever the software offers by default.
| Chart | Data it takes | Typical GMP use | Watch out for |
|---|---|---|---|
| Individuals and moving range (I-MR) | One value per batch | Assay, dissolution mean, yield, water content per batch | Sensitive to non-normal data; few points per year on a low-volume product |
| X-bar and R | Small subgroups, n of about 2 to 10 | Tablet weight or hardness from in-process checks every 30 minutes | Limits from within-subgroup variation; batch-to-batch shifts can flood it with signals |
| X-bar and S | Larger subgroups | Checkweigher or fill-weight samples of 10 or more | Needs a stable sampling plan |
| p or np chart | Proportion of defective units | Rejects at visual inspection, leak-test failures | Varying lot size changes the limits (p chart) |
| c or u chart | Count of defects | Particles per unit, cosmetic defects per area, environmental colonies per plate | Check that the counts behave as the chart assumes |
The FDA guidance asks for scrutiny of both intra-batch and inter-batch variation. For a parameter like tablet weight that usually means two charts: an X-bar and R chart inside the batch to watch the press, and an I-MR chart of batch means to watch the product over months.
Choosing what to chart
ICH Q8(R2) gives the vocabulary. A critical quality attribute (CQA) is a property that must stay within a limit, range or distribution to ensure product quality; a critical process parameter (CPP) is one whose variability has an impact on a CQA. ICH Q10 asks the monitoring system to analyse the parameters and attributes identified in the control strategy. So start from the Stage 1 risk assessment, not from whatever tags the historian happens to collect.
Attributes such as assay, content uniformity, dissolution, impurities or bioburden tell you about the product, but late, and often only once per batch. Parameters such as granulation end-point, compression force, freeze-drying shelf temperature or sterilisation F0 move first, inside the batch, and point you towards the cause. Inputs matter too: particle size or water content of incoming materials, which the FDA lists among the data to collect. A supplier change usually shows up there before anywhere else.
How many points do you need before setting limits? The FDA recommends monitoring at the level used during process qualification “until sufficient data are available to generate significant variability estimates”, then adjusting. Put the number of points in the protocol. On a product made twelve times a year, the limits will stay trial limits for a long while, and the protocol should say so honestly.
Alert and action rules
The FDA expects good process design to establish “appropriate alert and action limits”. On a chart, action usually means a point beyond three sigma. Alert means a pattern, caught by run rules. Lloyd Nelson set out eight tests for special causes in the Journal of Quality Technology in October 1984, building on the earlier Western Electric rules. The ones most sites keep are a point beyond three sigma, nine points in a row on one side of the centre line, six points steadily rising or falling, and two out of three points beyond two sigma on the same side.
Each rule you add catches a different kind of change, and each one adds false alarms. All eight rules on fifty charts is precisely the overreaction the FDA warns about. Choose the rules chart by chart, write them into the protocol with the reason, and leave them alone.
A broken run rule is not automatically a deviation; it triggers a documented assessment. EU GMP Chapter 6 asks for out-of-trend data to be addressed and investigated, so the procedure has to say who looks, how quickly, and what turns an assessment into a deviation or a corrective and preventive action (CAPA).
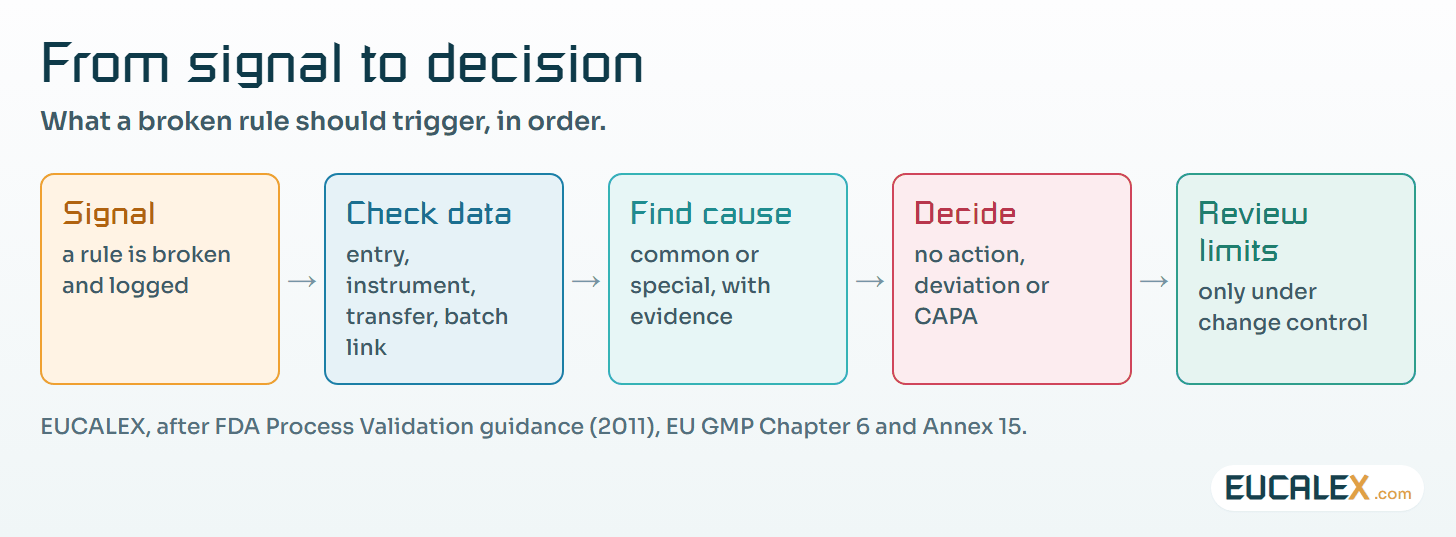
Recalculate limits when the process changes for a documented reason, such as a new supplier or a validated equipment change, and never because a chart has become inconvenient. Annex 15 asks for the extent and frequency of ongoing verification to be reviewed periodically, and that review is the right moment to revisit limits, rules and sampling.
The data behind the chart
A control chart is a GMP record built out of other GMP records. Values often travel from a laboratory system or a manufacturing execution system into a historian, then into a statistics package or a spreadsheet. EU GMP Annex 11 asks that systems exchanging data electronically include built-in checks for correct and secure entry and processing, and that GMP-relevant changes and deletions leave an audit trail with a reason. Every transfer is a chance to lose, round or misattribute a value.
Three things deserve particular care. Exclusions first: a point removed from a chart is a decision about data, so it needs a reason, a name and a date, and the original value must stay visible somewhere. Then the limits themselves. The current limits, the data they came from and the date they took effect are part of the record, and a chart whose limits were quietly recomputed last month cannot show a trend. Finally context. A value without its unit, method, batch, time and source is a number, not a result; we wrote about this in metadata: the part of the record that makes the number mean something.
The Pharmaceutical Inspection Co-operation Scheme spells out what is at stake. Its data integrity guidance PI 041-1 (July 2021) gives, as an example of a major deficiency, data “altered to give a more favourable trend”, even when the original results were within specification. A trend is evidence, and it is held to the same standard as the results it is made from.
Where to start
- Pick one product with enough batches a year and list its CQAs and CPPs from the existing risk assessment, not from the historian.
- Pull the batch data since process performance qualification and plot them in time order before calculating anything. Look at the picture first.
- Choose one chart per parameter using the table above, and calculate trial limits from data with no known special cause.
- Write the protocol Annex 15 asks for: parameters, charts, limits, run rules per chart, sampling, who reviews and how often, and what a signal triggers.
- Validate the data path from source to chart for its intended use, including the spreadsheet if there is one; the qualification logic in what each qualification stage proves applies to the tool too.
- Report the charts and capability indices in the product quality review, and use that review to adjust limits, rules and sampling under change control.
Five common mistakes
- Charting the specification. Drawing the registered limits as the only lines turns a control chart into a pass-fail list and hides every drift that stays inside them.
- Capability before stability. A Cpk on a process that is not in control is a number with no meaning, however good it looks in the review.
- Every rule on every chart. Eight run rules on fifty charts produce more signals than anyone can assess, and people soon learn to ignore them.
- Limits that follow the data. Recalculating limits automatically every month absorbs the very drift you were meant to detect.
- An unvalidated path. A chart fed by a manual copy into an uncontrolled spreadsheet will not survive the first question about where a point came from.
A batch that passes tells you about that batch. A process in control tells you about the next one, and that is what Stage 3 asks for.
References
- US FDA, *Process Validation: General Principles and Practices*, guidance for industry, January 2011, section IV.D (Stage 3, continued process verification).
- European Commission, *EudraLex Volume 4, Annex 15: Qualification and Validation*, in operation 1 October 2015, paragraphs 5.28–5.32 and glossary.
- ISO, *ISO 7870-2:2023 Control charts — Part 2: Shewhart control charts*, edition 2, March 2023.
- L. S. Nelson, *The Shewhart Control Chart — Tests for Special Causes*, Journal of Quality Technology 16(4), October 1984.
- PIC/S, *PI 041-1 Good Practices for Data Management and Integrity in Regulated GMP/GDP Environments*, 1 July 2021, section 11.
- Automation.com (ISA), *Process Control Charts in Manufacturing Excellence*, 25 March 2025 (the item that prompted this article).
Related articles
All articles- DQ, IQ, OQ, PQ: what each qualification stage proves, and what it cannotFrom the quality concept and the URS to the PQ, one question per stage. A plain reference for the engineers and technicians who sign qualification…
- Packaging line PQ: sampling plans, defect classes, and why a failed run is good newsInstallation and operational qualification prove each machine. The performance qualification proves the whole line, with real product and real…
- Metadata: the part of the record that makes the number mean somethingA value of 23 means nothing until you know its unit, its source, its time and who produced it. Where metadata is lost between instrument and report…
EUCALEX
Have a project or a technical challenge?
Contact us: we will be pleased to discuss it with you, with no commitment.
Discuss your project with usStay informed
Receive new EUCALEX articles and technical insights by email.